My Journey Debugging React Performance: From Laggy to Instant
A calculator that freezes for 400 ms per interaction feels broken, even if the math is correct. This post is a real debugging log from our tool pages.
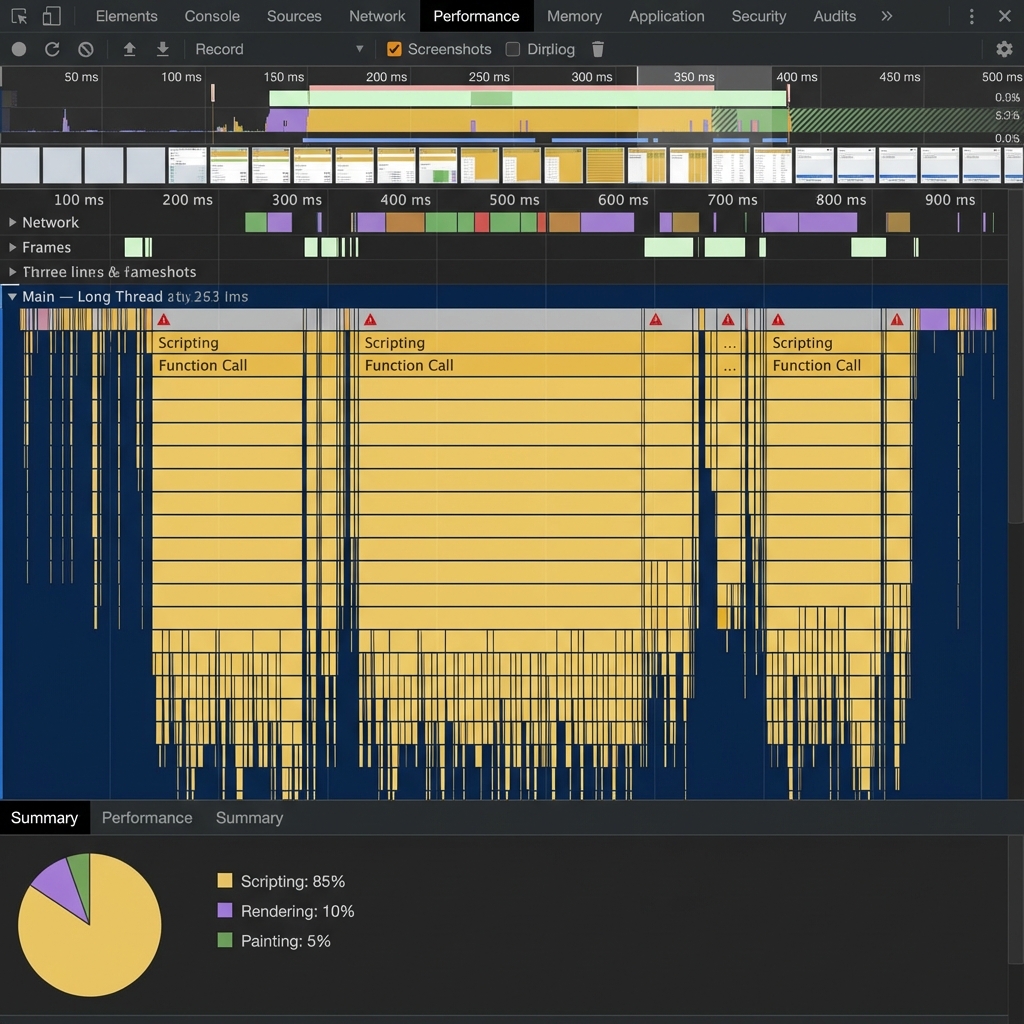
The pain point was simple: users dragged a slider and the UI stuttered. On older devices, the lag made the tool nearly unusable.
3 SEO Title Options You Can Test
- 7 React Performance Mistakes That Make Scientific Tools Feel Slow
- 2026 Frontend Playbook: 9 Fixes for Laggy Calculator UIs
- From 2 FPS to 60 FPS: 5 Debugging Steps That Actually Worked
3 Real Moments from the Debug Session
1) The "Works on My Machine" Trap
On my desktop, interactions looked smooth. On a teammate's older laptop, dragging the slider caused visible freezes.
2) The Over-Memoization Loop
I had wrapped too much logic in useMemo and useCallback. Dependency checks became part of the bottleneck.
3) Simpler Props, Faster UI
Passing large objects caused extra re-renders. Passing primitives reduced churn and made updates predictable.
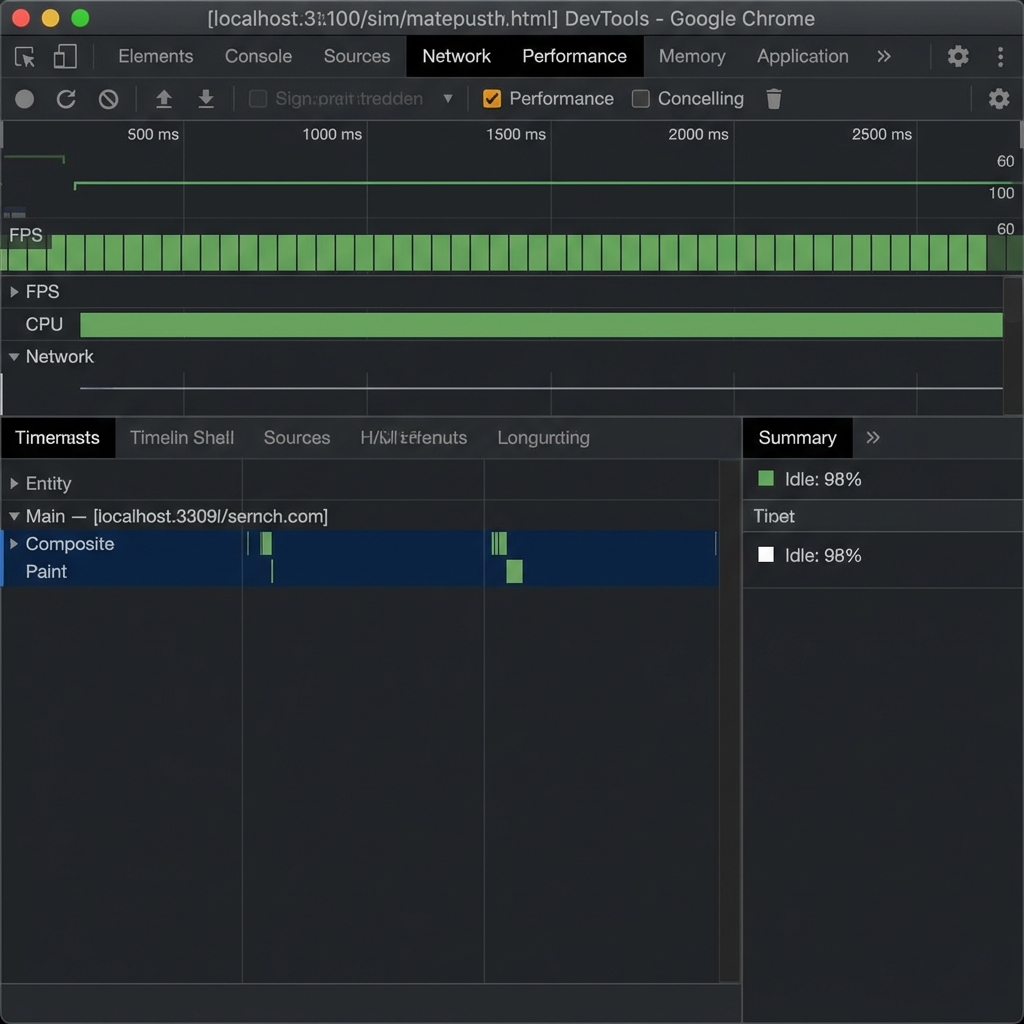
Pro Tip: Measure first in Performance tools. Guessing the bottleneck is slower than profiling it.
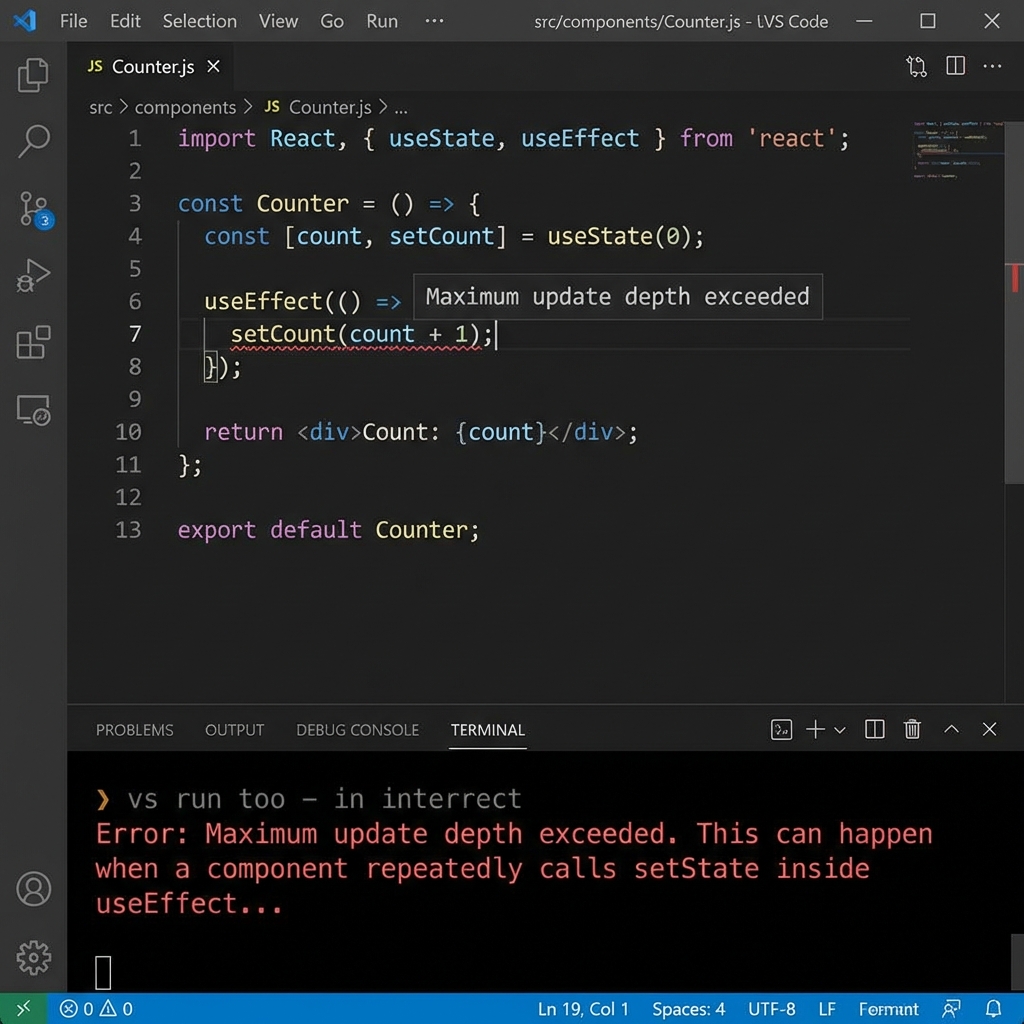
The Error Trace That Finally Unblocked Me
The biggest clue came from a repeatable stack trace during heavy slider use. I stopped guessing and worked from the trace line by line.
TypeError: Cannot read properties of undefined (reading 'toFixed')
at formatResult (calculator.tsx:184:29)
at updatePreview (calculator.tsx:236:17)
at onSliderChange (calculator.tsx:301:9)
The root cause was stale derived state arriving one render late. I moved formatting behind null guards and removed a redundant render hop.
| Symptom | Root Cause | Fix Applied | Result |
|---|---|---|---|
| Slider lag | Heavy rerender tree | Reduced prop complexity | Smoother interaction |
| CPU spikes | Overuse of memo hooks | Removed unnecessary memoization | Lower scripting time |
| Inconsistent behavior | Different device performance baselines | Profiled on lower-end hardware | Stable cross-device UX |
How This Connects to Tool Hub Users
Our audience uses calculators under time pressure. Fast response is part of scientific reliability, not a cosmetic feature.
I now test every interactive page against practical usage flows. These lessons also shaped the Titration Curve Simulator and Molarity Calculator.
If you run qPCR workflows, this reproducibility playbook shows the same principle in lab ops: standardize first, then optimize.
Pro Tip: If performance gains rely on complexity, they usually fail at maintenance time. Prefer simple data flow and profile-backed changes.
Use the Faster Calculator Workflow
Open Tool Hub calculators built with the same profiling-first fixes so interactions stay smooth on older devices too.
Have a stubborn React lag pattern in your tool UI? Leave a comment and I can share a focused profiling checklist.